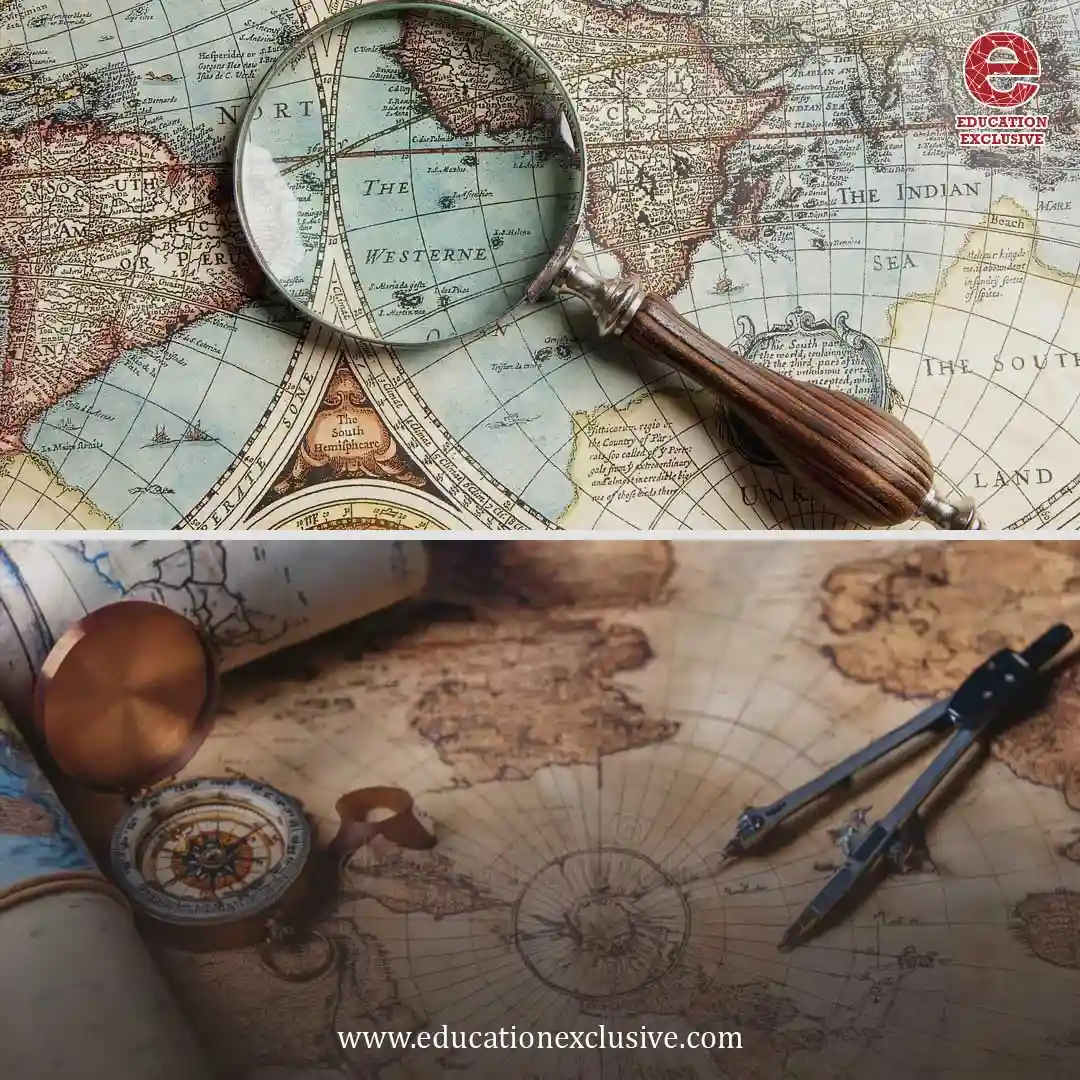
Cartography : From Ancient Maps to Modern GIS
Exclusive Insights
Imagine! You're a pirate, standing on the deck of your ship, the salty sea breeze tousling your hair. The sun is setting, casting a fiery glow over the horizon. In your hands, you hold a weathered map, its edges frayed, its ink faded by years of adventure. This isn't just any map, though. It's the map that promises treasure beyond your wildest dreams, guarded by monsters and storms that could send any lesser sailor running for the hills. From Pirates of the Caribbean to the earliest sea explorers, maps like this have been more than just tools; they are the blueprints for destiny.
Whether the compass rose to guide Jack Sparrow's ship through the mist or the ancient treasure maps scribbled with cryptic symbols and hidden routes, maps have been the secret keys, unlocking the world's greatest mysteries. But the truth behind these maps is far more thrilling and complex than you might think. Buckle up because we're about to set sail into cartography's fascinating history and future.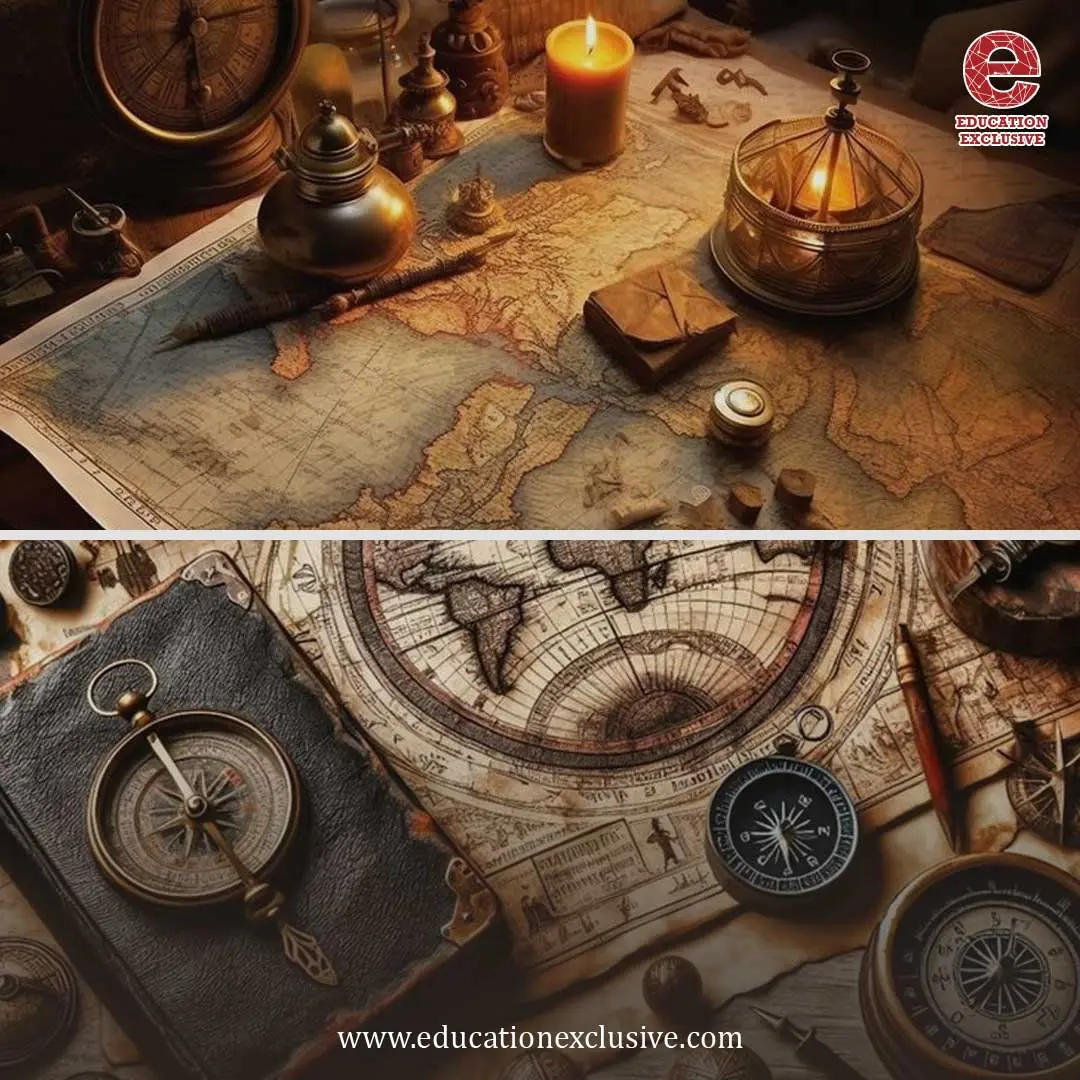
The art and science of creating and using maps, a vital tool in everyday life for navigation, planning, and understanding our world, is called Cartography. It blends science, design, and technology to transform data into visual representations of space. Cartography is behind it all, whether it's a map guiding you through a city, a weather forecast showing storm patterns, or a GPS helping you find the quickest route. The process involves:
-
Collecting and analysing data.
-
Designing the map.
-
Producing the final product is often a team effort, as each step requires specialised skills.
From printed atlases to digital apps, maps shape how we navigate and interpret our surroundings.
Cartography is More than just Maps

Cartography is more than just creating maps; it's a dynamic academic field with professional organisations, journals, conferences, and educational programs. It's a vibrant community that includes mapmakers, educators, and researchers. Once seen as simple tools for navigation, maps are now recognised as complex, intellectual creations that open doors to deep scientific exploration. From studying how we perceive maps to exploring their historical significance or developing new mapping technologies, cartographers are pushing the boundaries of what maps can tell us about the world and how we understand it.
Today, Cartography has two defining features. First, it is indispensable. Maps are foundational to countless activities that shape our world, from urban planning and property ownership to disaster response and natural resource management. Whether forecasting weather, building roads, or managing forests, maps make these tasks possible. Effective mapping is crucial to finding solutions in today's world, where environmental challenges are more urgent than ever. Thanks to powerful tools like remote sensing and GIS, Cartography is helping to tackle some of humanity's most pressing issues.
The second key characteristic is the field's dynamic nature. Cartography is undergoing a revolution driven mainly by technological advances, especially the rise of computers. While technology has always influenced map-making, today's changes are unprecedented in scale and impact. The digital age has transformed how maps are created, used, and understood, opening up new possibilities for innovation and exploration.
The fundamental objectives of traditional Cartography are to:
-
Set the map's agenda and select traits of the object to be mapped. This is the concern of map editing. Traits may be physical, such as roads or land masses, or may be abstract, such as toponyms or political boundaries.
-
Represent the terrain of the mapped object on flat media. This is the concern of map projections.
-
Eliminate the mapped object's characteristics that are irrelevant to the map's purpose. This is the concern of generalisation.
-
Reduce the complexity of the characteristics that will be mapped. This is also the concern of generalisation.
-
Orchestrate the elements of the map to convey its message to its audience best. This is the concern of map design.
History
_1733142862.webp)
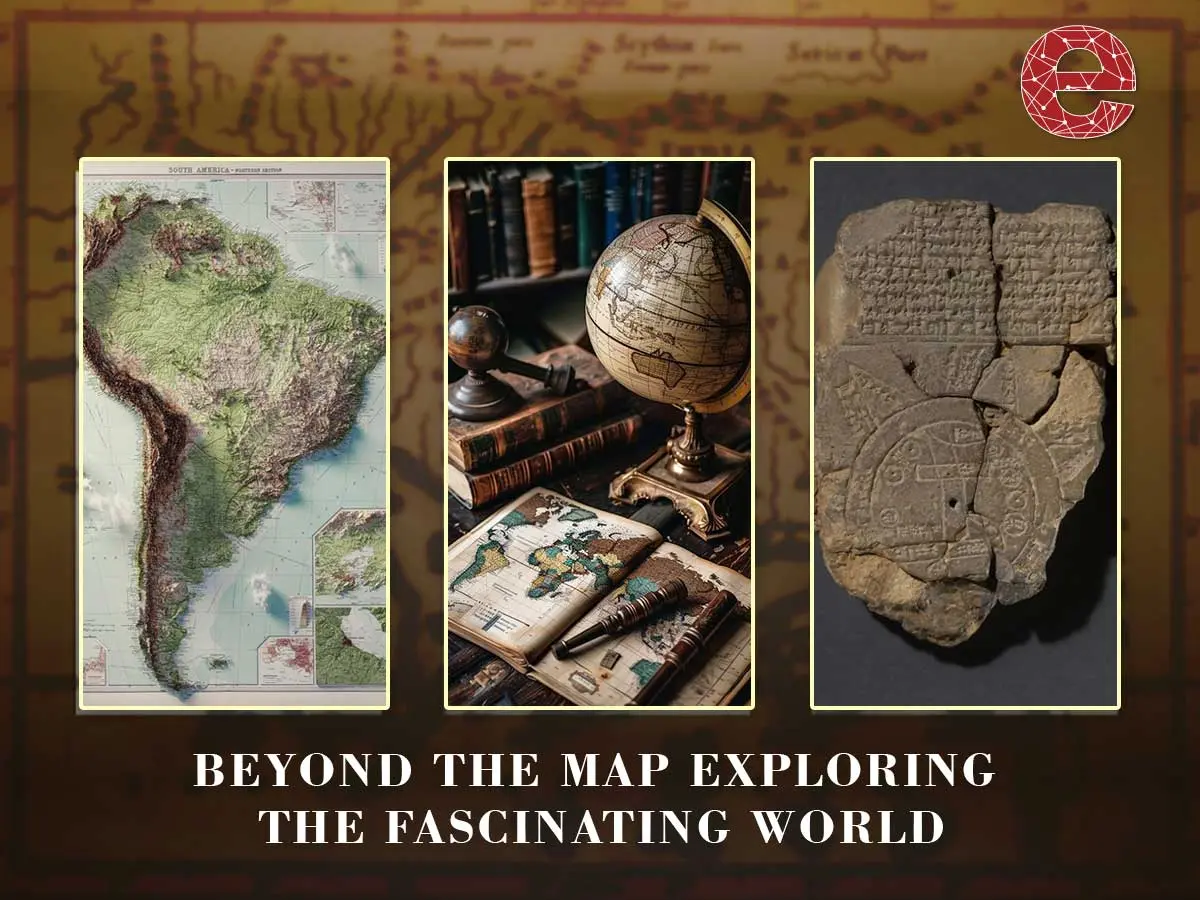
The history of Cartography traces the evolution of mapmaking from ancient times to the present, reflecting advancements in exploration, science, and technology.
- Ancient Maps: Early maps were created by the Babylonians (around 2300 BCE), Egyptians (circa 1600 BCE), and Greeks. The Babylonian World Map and the Greek philosopher Anaximander's maps marked the beginning of geographical representation. Greek scholar Ptolemy (2nd century CE) created influential maps based on a grid system, laying the foundation for later mapmaking.
- Medieval Maps: In the Middle Ages, European maps were often symbolic, reflecting religious beliefs, like the T-O maps, with Jerusalem at the centre. Meanwhile, Islamic Cartographers like Al-Idrisi produced more accurate maps, blending Greek and new geographical knowledge.
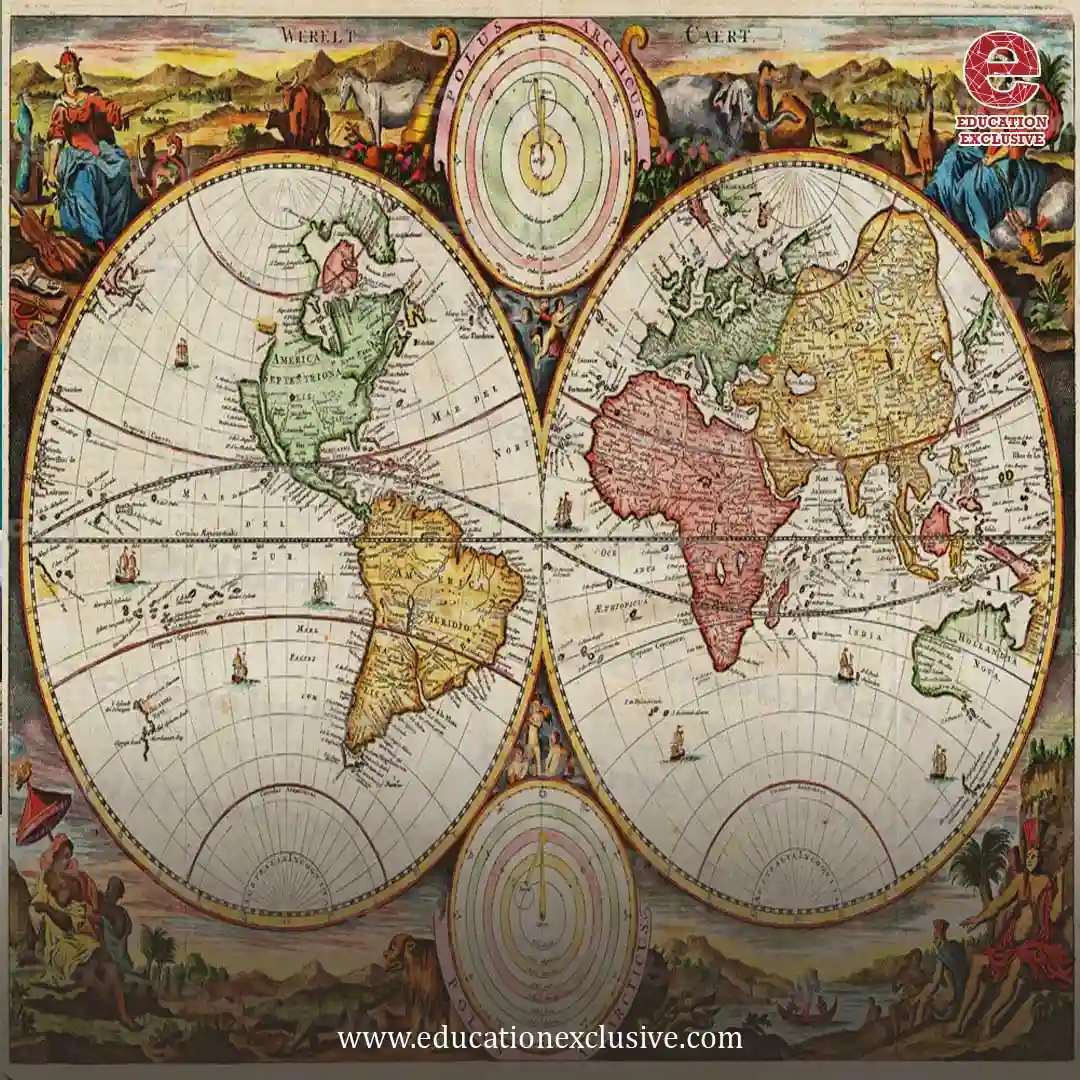
- Age of Exploration: The 15th-17th centuries saw significant advances due to European exploration. Explorers like Columbus and Vasco da Gama contributed valuable data. The Mercator projection (1569), developed by Gerardus Mercator, revolutionised navigation by showing lines of constant bearing.
- Modern Cartography: In the 18th-19th centuries, scientific advancements such as trigonometry and precise longitude measurements led to more accurate maps. National surveys like the British Ordnance Survey began, and topographic mapping became widespread.
- 20th Century and Beyond: Aerial photography and satellite imagery transformed mapmaking, while GIS (Geographic Information Systems) and digital mapping in the 21st century made maps interactive and real-time. Today, platforms like Google Maps use global positioning technology to create dynamic, user-driven maps.
Lettering
Lettering plays a crucial role in mapmaking, helping to convey important information. In early woodcut maps, fine lettering was challenging to achieve because the process often resulted in square, blocky letters, which didn’t match the elegant, rounded writing style popular in Italy at the time. To improve this, mapmakers created fine chisels for carving more detailed reliefs. Intaglio engraving, a technique where the design is carved into a surface, allowed for smoother, more flowing cursive lettering known as ‘Cancellaresca’. Additionally, custom-made reverse punches were used in metal engraving, along with freehand lettering, to create more refined text on maps.
Colour
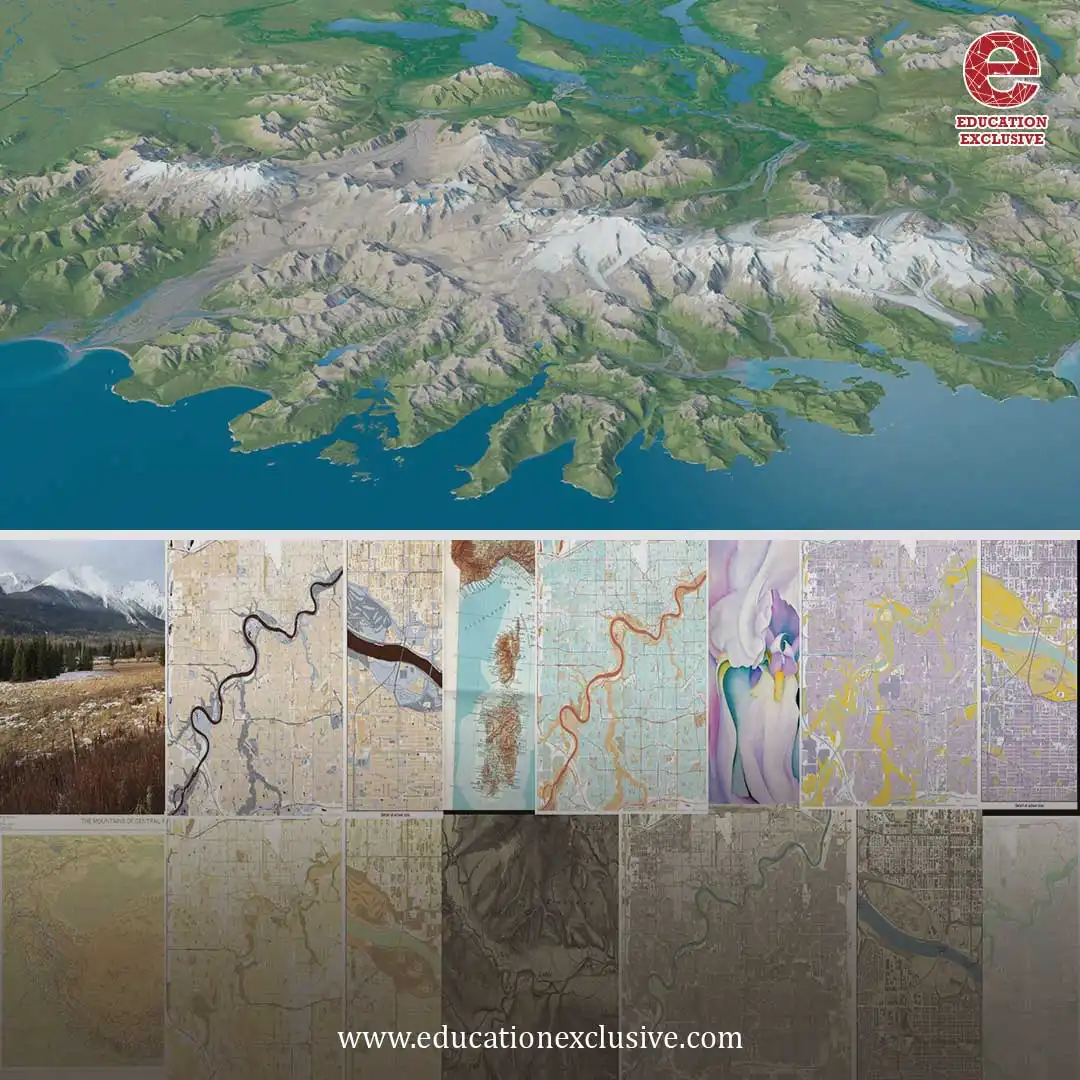
The use of colour in mapmaking didn’t have a single origin; it evolved for practical and aesthetic reasons. Some argue that colour was first used to convey information, with the visual appeal coming later. In contrast, others believe the colour was initially added for decoration and later adapted to show details. Many maps were published in the Renaissance without colour, a practice that continued into the 1800s. However, map publishers would often colour maps upon request, and patrons could choose between basic or more elaborate colouring, sometimes even with gold or silver accents. The simplest form of colouring involved outlining borders or rivers, while wash colour used inks or watercolours to fill regions. More elaborate techniques, like limning, involved adding gold or silver leaf to highlight lettering, coats of arms, or other decorative elements.
Deconstruction
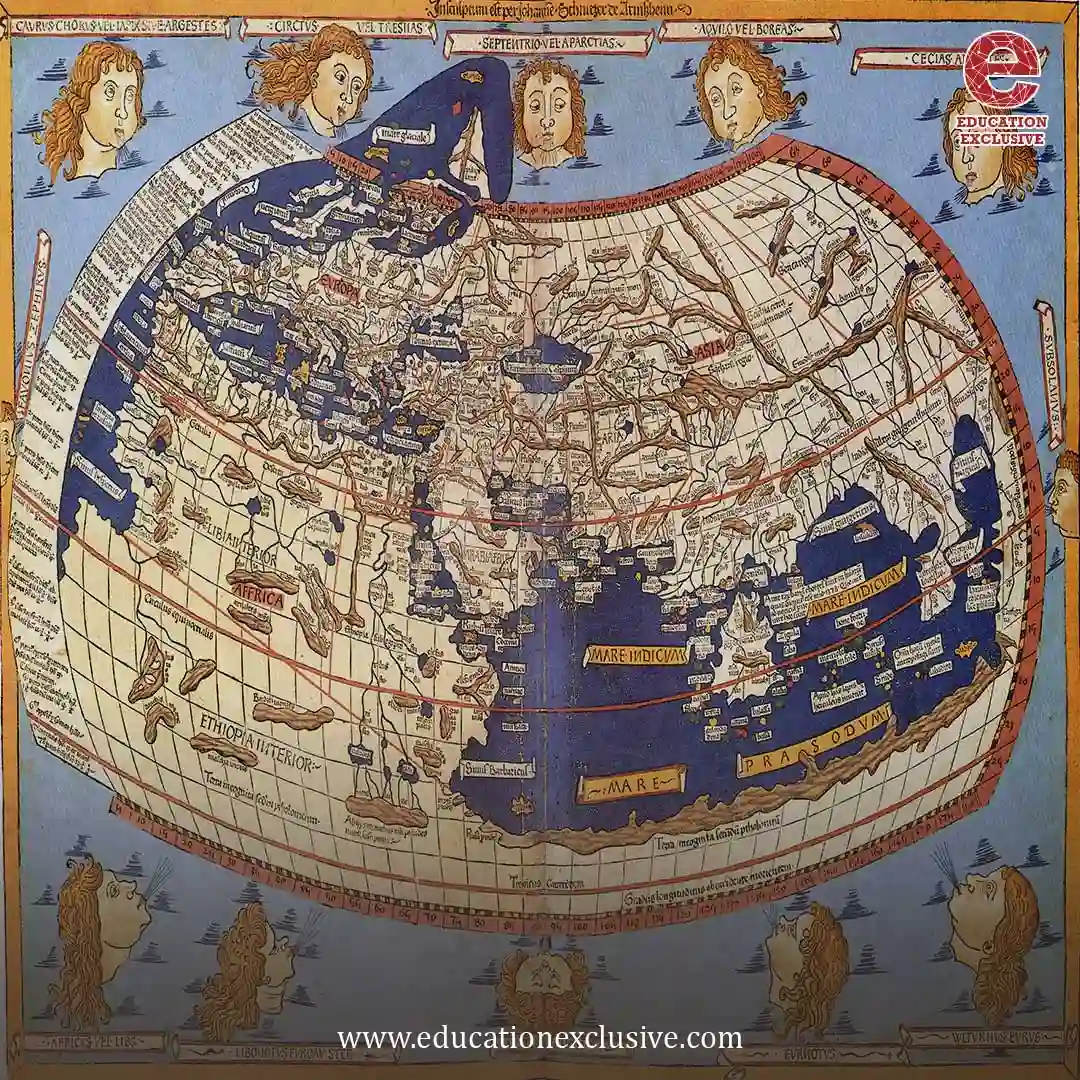
Maps are not just technical tools; they also reflect cultural influences and biases. The process of "deconstructing" a map involves analyzing how it may reflect power, bias, and underlying agendas. Deconstructionists argue that maps are inherently biased and convey metaphorical and rhetorical messages. In fact, maps have been seen as powerful tools for shaping perceptions and knowledge.
Since the 17th century, Europeans promoted a particular "epistemological" approach to maps, viewing them as objective representations of reality through mathematical measurements and systematic observation. This belief fueled the idea that maps created through scientific methods were superior, leading to the perception that European maps were the gold standard. In contrast, maps from other cultures were seen as inaccurate or flawed.
One area often scrutinised through deconstruction is the depiction of Africa. During the age of imperialism, maps became tools for European powers to assert control over African territories. The Mercator projection, in particular, has been criticized for distorting the size of Africa and other low-latitude regions, making them appear smaller than the European-dominated higher latitudes. This distortion has been interpreted as symbolic of imperial subjugation, reflecting a European worldview that marginalized non-European regions.
Maps of Africa played a significant role in the imperial conquest of the continent by showing essential details like roads, resources, and settlements. These maps enabled European powers to exploit Africa's natural resources, establish trade routes, and efficiently conduct military campaigns. These maps also helped to justify territorial claims, as seen during the Berlin Conference of 1884–1885, where European nations divided Africa.
Before the mid-18th century, maps of Africa were filled with speculative drawings of animals, imaginary geographical features, and vague descriptions of areas that were unknown or unexplored. In 1748, French Cartographer Jean B. B. d'Anville created a more accurate map of Africa, marking the unknown areas as blank spaces, an important step towards more realistic representations of the continent.
Map Types
Cartography can be divided into three main types of maps: general, thematic, and
special-purpose (or orienteering) maps._1733143117.webp)
General Cartography involves maps created for a broad audience, often showing various features. These maps include reference and location systems, usually produced in a series. For example, the United States Geological Survey (USGS) produces standard topographic maps at a 1:24,000 scale, while the UK produces detailed Ordnance Survey maps at a 1:50,000 scale. These maps serve as general guides to a wide range of users.
Thematic Cartography focuses on specific geographic topics or themes, catering to particular audiences. For instance, a map showing corn production in Indiana or one that highlights population density in Ohio counties. Thematic maps are increasingly crucial as more geographic data becomes available, helping to interpret social, cultural, and spatial information.
Orienteering Maps fall between general and thematic maps. These maps blend general features with thematic details for a specific audience, such as maps used by people in particular industries. For example, a municipal utility map might combine general geographic features with specific utility infrastructure.
Another distinction in Cartography is between topographic and topological maps.
A topographic map provides detailed terrain descriptions, often using contour lines to show elevation. These maps can depict landforms in various ways, and today, digital elevation models (DEMs) are widely used by computer software. Before digital tools, Cartographers like Eduard Imhof were known for their masterful hand-drawn shaded reliefs.
Each is designed to serve a specific purpose. Here's a brief overview of the most common types of maps:
1. Political Maps
Purpose: Show boundaries of countries, states, provinces, cities, and other political divisions.
Features: Highlight borders, capitals, and major cities.
Example: A map of the world showing countries and capitals.
2. Physical Maps
Purpose: Depict the physical landscape of an area.
Features: Show natural features such as mountains, rivers, lakes, and deserts, often with colour shading to indicate elevation (e.g., green for lowlands, brown for highlands).
Example: A map showing the Alps mountain range or the Nile River.
3. Topographic Maps
Purpose: Provide detailed, accurate information about the terrain and surface features.
Features: Include contour lines to represent elevation changes, along with roads, rivers, forests, and buildings.
Example: A map used for hiking or land surveying that shows mountain contours and paths.
4. Thematic Maps
Purpose: Focus on specific topics or themes (such as climate, population density, or economic activity).
Features: Use colours, shading, or symbols to represent data on a particular subject.
Example: A population density map showing regions with the most or least people.
5. Road Maps
Purpose: Provide detailed information about roads, highways, and routes for navigation.
Features: Show roads, street names, highways, towns, and points of interest.
Example: A map used by travellers for driving directions.
6. Weather Maps
Purpose: Represent meteorological data such as temperature, precipitation, wind patterns, and pressure systems.
Features: Use symbols to show weather conditions, such as thunderstorms, rain, and snow.
Example: A map showing weather patterns for a particular region.
7. Satellite Maps
Purpose: Show the Earth's surface as seen from satellites, providing a real-world view.
Features: High-resolution images of Earth, often including natural and artificial features.
Example: Google Earth, where you can zoom in to see cities and landscapes.
8. Historical Maps
Purpose: Show the geographic layout of a region at a specific point in history.
Features: Include political boundaries, land uses, and historical landmarks from the past.
Example: A map showing the world during the Roman Empire or the spread of the Black Death.
9. Navigational Maps
Purpose: Aid navigation on land or sea.
Features: Include coordinates, latitude/longitude lines, and often topography for ships or aircraft.
Example: A nautical chart for sailors or a topographic map for mountaineers.
10. Census and Population Maps
Purpose: Display information about population, demographics, and density.
Features: Use colours or dots to represent population density, age groups, or other demographic information.
Example: A map showing the distribution of ethnic groups in a country.
Map design
Modern Cartography continues to benefit from advancements like 3D mapping, augmented reality (AR), and artificial intelligence (AI). Digital platforms, powered by crowdsourcing, enable users to contribute and update map data, improving accuracy in real-time. Additionally, GIS software allows for complex data visualisation, such as thematic maps, to represent specific datasets like population density, climate change, or traffic patterns. AI and machine learning are automating map creation, analysing patterns, and predicting geographic changes, further enhancing the precision and utility of maps. With these technological innovations, Cartography has become a vital tool in urban planning, disaster response, environmental monitoring, and everyday navigation.
Cartographic Design
Cartographic design or map design is the process of crafting the appearance of a map, applying the principles of design and knowledge of how maps are used to create a map that has both aesthetic appeal and practical function. It shares this dual goal with almost all forms of design; it also shares with other designs, especially graphic design, the three skill sets of artistic talent, scientific reasoning, and technology. As a discipline, it integrates design, geography, and geographic information science.
Arthur H. Robinson, considered the father of Cartography as an academic research discipline in the United States, stated that a map not properly designed "will be a Cartographic failure." He also claimed, when considering all aspects of cartography, that "map design is perhaps the most complex."
Modern technology, including advances in printing, the advent of geographic information systems and graphics software, and the Internet, has vastly simplified the process of map creation and increased the palette of design options available to Cartographers. This has led to a decreased focus on production skills and an increased focus on quality design, the attempt to craft maps that are both aesthetically pleasing and practically useful for their intended purposes.
Cartographic Process
The Cartographic process spans many stages, from conceiving the need for a map and extending through its consumption by an audience. Conception begins with a real or imagined environment. As the Cartographer gathers information about the subject, they consider how that information is structured and how that structure should inform the map's design. Next, the Cartographers experiment with generalisation, symbolisation, typography, and other map elements to find ways to portray the information so that the map reader can interpret the map as intended. Guided by these experiments, the Cartographer settles on a design and creates the map, whether physically or electronically. Once finished, the map is delivered to its audience. The map reader interprets the symbols and patterns on the map to draw conclusions and take action. By the spatial perspectives they provide, maps help shape how we view the world.
Aspects of Map Design
Designing a map involves bringing together several elements and making many decisions. The aspects of design fall into several broad topics, each with its theory, research agenda, and best practices. That said, there are synergistic effects between these elements, meaning that the overall design process is not just working on each aspect one at a time but an iterative feedback process of adjusting each to achieve the desired gestalt.
Areal distortion caused by Mercator projection:
- Map projections: The foundation of the map is the plane on which it rests (whether paper or screen), but forecasts are required to flatten the surface of the Earth or other celestial bodies. While all projections distort the surface, Cartographers strategically control how and where distortion occurs. For example, the popular Mercator projection does not distort angles on the surface, but it makes regions near the poles appear larger than they are.
- Generalisation: All maps must be drawn at a smaller scale than reality, requiring that the information included on a map be a tiny sample of information about a place. Generalisation is the process of adjusting the level of detail in geographic data to be appropriate for the scale and purpose of a map through procedures such as selection, simplification, and classification.
- Symbology: Any map visually represents the location and properties of geographic phenomena using map symbols and graphical depictions composed of several visual variables, such as size, shape, colour, and pattern.
- Composition: As all symbols are brought together, their interactions significantly affect map reading, such as grouping and visual hierarchy.
- Typography or labelling: Text serves several purposes on the map, significantly aiding the recognition of features, but labels must be designed and positioned well to be effective.
- Layout: The map image must be placed on the page (whether paper, web, or other media), along with related elements such as the title, legend, additional maps, text, images, and so on. Each of these elements has its own design considerations, as does their integration, which largely follows the principles of graphic design.
- Map type-specific design: Different kinds of maps, especially thematic maps, have their own design needs and best practices.
Cartography and Technology
Cartography, the science of mapmaking, has evolved significantly with technological advancements. Historically, maps were drawn by hand using essential tools, and the available technology, such as the compass and sextant, limited early mapping techniques. The 20th century brought revolutionary changes with the advent of aerial photography, satellite imagery, and remote sensing. These technologies allowed for highly accurate and detailed maps of the Earth's surface. The development of Geographic Information Systems (GIS) in the 1960s enabled the digital storage, analysis, and manipulation of geographic data, transforming Cartography into a dynamic, interactive discipline. Today, GPS technology allows precise location tracking, empowering applications like Google Maps and OpenStreetMap for real-time navigation and mapping.
Modern Cartography continues to benefit from advancements like 3D mapping, augmented reality (AR), and artificial intelligence (AI). Digital platforms powered by crowdsourcing enable users to contribute and update map data, improving real-time accuracy. Additionally, GIS software allows for complex data visualisation, such as thematic maps, to represent specific datasets like population density, climate change, or traffic patterns. AI and machine learning are automating map creation, analysing patterns, and predicting geographic changes, further enhancing the precision and utility of maps. With these technological innovations, Cartography has become vital in urban planning, disaster response, environmental monitoring, and everyday navigation.
Cartographic Design
Cartographic design or map design is the process of crafting the appearance of a map, applying the principles of design and knowledge of how maps are used to create a map that has both aesthetic appeal and practical function. It shares this dual goal with almost all design forms and other designs, especially graphic design, the three skill sets of artistic talent, scientific reasoning, and technology. It integrates design, geography, and geographic information science as a discipline.
Arthur H. Robinson, the father of Cartography as an academic research discipline in the United States, stated that a properly designed map "will be a Cartographic failure." When considering all aspects of Cartography, he also claimed that map design is perhaps the most complex."
Future of cartography
The future of Cartography is poised to be shaped by advancements in technology, data collection, and visualisation techniques, leading to more dynamic, interactive, and personalised mapping experiences. Here are some key trends and possibilities: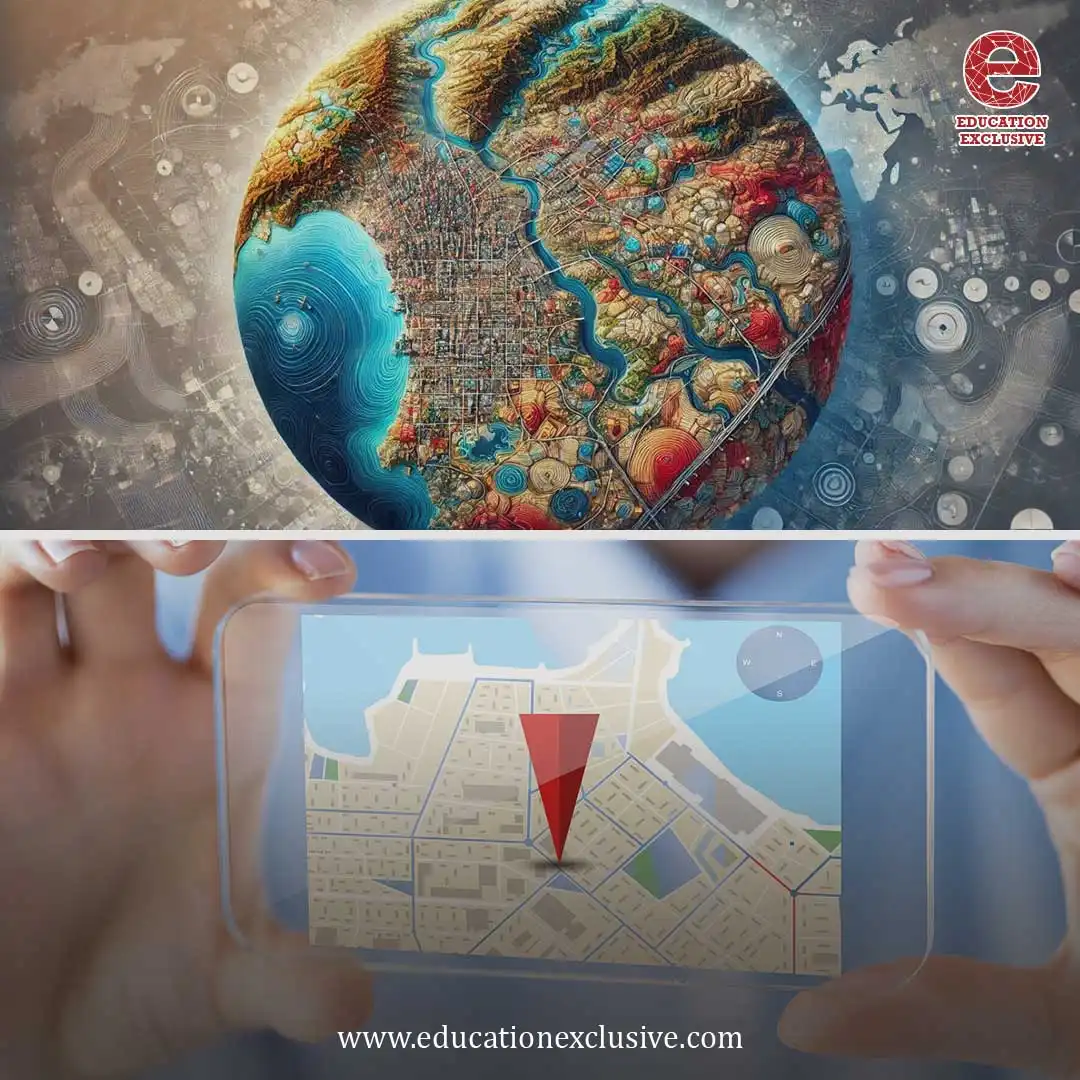
-
Real-Time and Dynamic Mapping: Integrating big data and real-time data feeds will allow for maps that continuously update with live information, such as traffic conditions, weather changes, environmental shifts, or emergency alerts. This will enhance user experience, particularly in navigation, disaster response, and urban planning.
-
3D and Immersive Mapping: With virtual reality (VR) and augmented reality (AR) technologies, the future of Cartography will likely feature fully immersive 3D maps. These could allow users to "walk through" cities, explore topographic terrain, or visualise complex data in three dimensions, providing unprecedented interaction and understanding.
-
Artificial Intelligence (AI) and Machine Learning: AI will continue to play a significant role in automating map creation, analysing geographic patterns, and improving predictive capabilities. Machine learning algorithms will help process vast amounts of geographic data more efficiently, creating more intelligent, more accurate maps with fewer human inputs.
-
Personalised Mapping: As Cartographic tools become more integrated with everyday technology, we can see maps customised to individual preferences or needs. For example, personalised navigation maps based on specific user behaviour or maps highlighting features tailored to certain activities, like hiking, cycling, or local events.
-
Crowdsourced and Open Data: The rise of crowdsourcing and open data platforms like OpenStreetMap will continue democratising mapmaking, allowing citizens to contribute to mapping efforts, especially in underrepresented or developing regions. This will foster more accurate and up-to-date maps and contribute to global mapping initiatives.
-
Integration of Spatial Data and IoT: The Internet of Things (IoT) will allow real-time sensor data to be integrated into maps, such as monitoring pollution levels, traffic patterns, or infrastructure conditions. This could lead to highly detailed, data-rich maps continuously updated to reflect real-world conditions.
-
Sustainability and Climate Mapping: As environmental concerns grow, future Cartography may focus more on climate change, sustainability, and resource management. Maps will be used to track deforestation, water levels, carbon footprints, and other ecological changes, helping to inform conservation efforts and policy decisions.
Career options in Cartography
_1733143285.webp)
Cartography is a versatile field that offers a wide range of career opportunities, particularly in geography, urban planning, technology, and environmental sciences. Here are some of the primary career options for individuals interested in Cartography:
Cartographer
A Cartographer designs and creates maps, often using specialised software like ArcGIS, QGIS, or AutoCAD. They may work on maps for navigation, education, urban planning, or environmental monitoring.
Geospatial Analyst
Geospatial analysts work with spatial data to analyse geographic patterns and trends. They use GIS software to interpret data for various applications, such as urban planning, agriculture, or disaster management
.
GIS Technician/Developer
GIS technicians support GIS systems by collecting, processing, and managing spatial data. They may also help develop and maintain GIS databases and platforms.
Remote Sensing Specialist
These professionals use satellite or aerial imagery data to analyze the Earth's surface. Their work supports applications in agriculture, environmental monitoring, military surveillance, and urban development.
Urban Planner
Urban planners often use maps and geographic data to design cities, transport networks, and infrastructure. Cartography helps them visualise and plan spaces efficiently, considering population growth and environmental sustainability.
Surveyor
Surveyors measure and map land, creating detailed plans and reports for construction, real estate, or government purposes. They may work in fields such as land surveying, hydrographic surveying, or geological mapping.
Geographer
Geographers study the Earth's surface and human-environment interactions. Many geographers specialise in Cartography, focusing on producing maps for research, policy planning, and education.
Cartographic Designer
Cartographic designers specialise in creating aesthetically pleasing and functional maps for various applications, including education, publications, and marketing. They focus on map readability, visual appeal, and effective communication of geographic information.
Best Colleges in India to Study Cartography and Related Fields:
Several universities and institutions in India offer courses in Cartography, GIS, and related subjects. Here are some of the top options:
- Indian Institute of Remote Sensing (IIRS) - Dehradun
- Banaras Hindu University (BHU) - Varanasi
- University of Delhi (DU) - Delhi
- Jawaharlal Nehru University (JNU) - Delhi
- Symbiosis Institute of Geoinformatics (SIG) - Pune
- Sardar Vallabhbhai National Institute of Technology (SVNIT) - Surat
- University of Madras - Chennai
- Pune University (Savitribai Phule Pune University) - Pune
- Indian Institute of Technology (IIT) Bombay
- Tezpur University - Assam
List of Best Cartographers
_1733143344.webp)
Modern rendering of Anaximander's 6th century BC world map
Ptolemy's 150 CE world map (as redrawn in the 15th century)
Anaximander, Greek Anatolia (610 BC–546 BC), first to attempt making a map of the known world
_1733143439.webp)
Jacobus Angelus, Florence, translated Ptolemy into Latin c. 1406
Martin Behaim (Germany, 1436–1507)
Benedetto Bordone (Venetian Republic 1460–1551)_1733143507.webp)
Giovanni Battista Agnese (c. 1500–1564), Genoese, Cartographer, author of numerous nautical atlases
Hacı Ahmet, Ottoman Tunisian Cartographer, translated 16th c. map into Turkish for the Ottoman Empire.
_1733143610.webp)
Pieter van der Aa (Netherlands, 1659–1733)
João Teixeira Albernaz I (Portugal, died c. 1664), prolific Cartographer, son of Luís Teixeira_1733143664.webp)
John James Abert (United States, 1788–1863), headed the Corps of Topographical Engineers for 32 years and organized the mapping of the American West
Anders Åkerman (Sweden, 1721/23–1778), first globemaker in Sweden
John Arrowsmith (England, 1790–1873), member of the Arrowsmith family of geographers
_1733143716.webp)
Robert Aitken of Beith. born c. 1786
Carlo de Candia (1803–1862), Italian Cartographer, created the large maritime map of Sardinia in 1: 250,000 scale, travel version.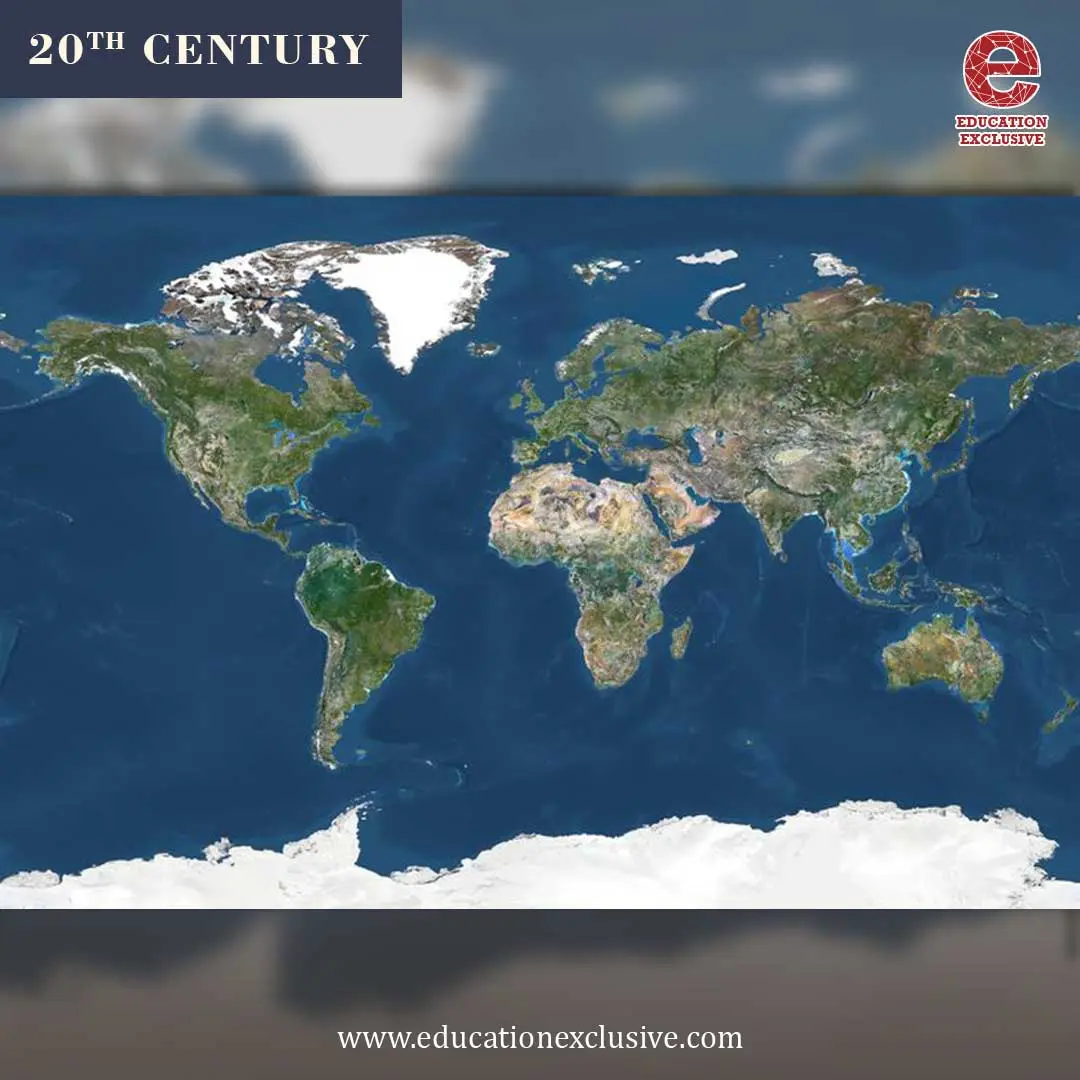
Jacques Bertin (France, 1918–2010)
Josef Breu (Austria, 1914–1998)
Cynthia Brewer (United States, 1957– ), developed ColorBrewer, professor at Penn State University
Conclusion
To wrap up, Cartography is a window into our understanding of the world, our history, and even our imagination. From ancient explorers to modern digital mapping, it has shaped how we navigate physical and conceptual landscapes. As technology continues to evolve, so will our ability to map the world in new, exciting ways. Whether guiding us to hidden treasures or charting the stars, Cartography remains a vital tool for discovery, adventure, and connection.
You can also read :Museology Studies A Great Career to Explore
- Cartography
- Importance of cartography

